
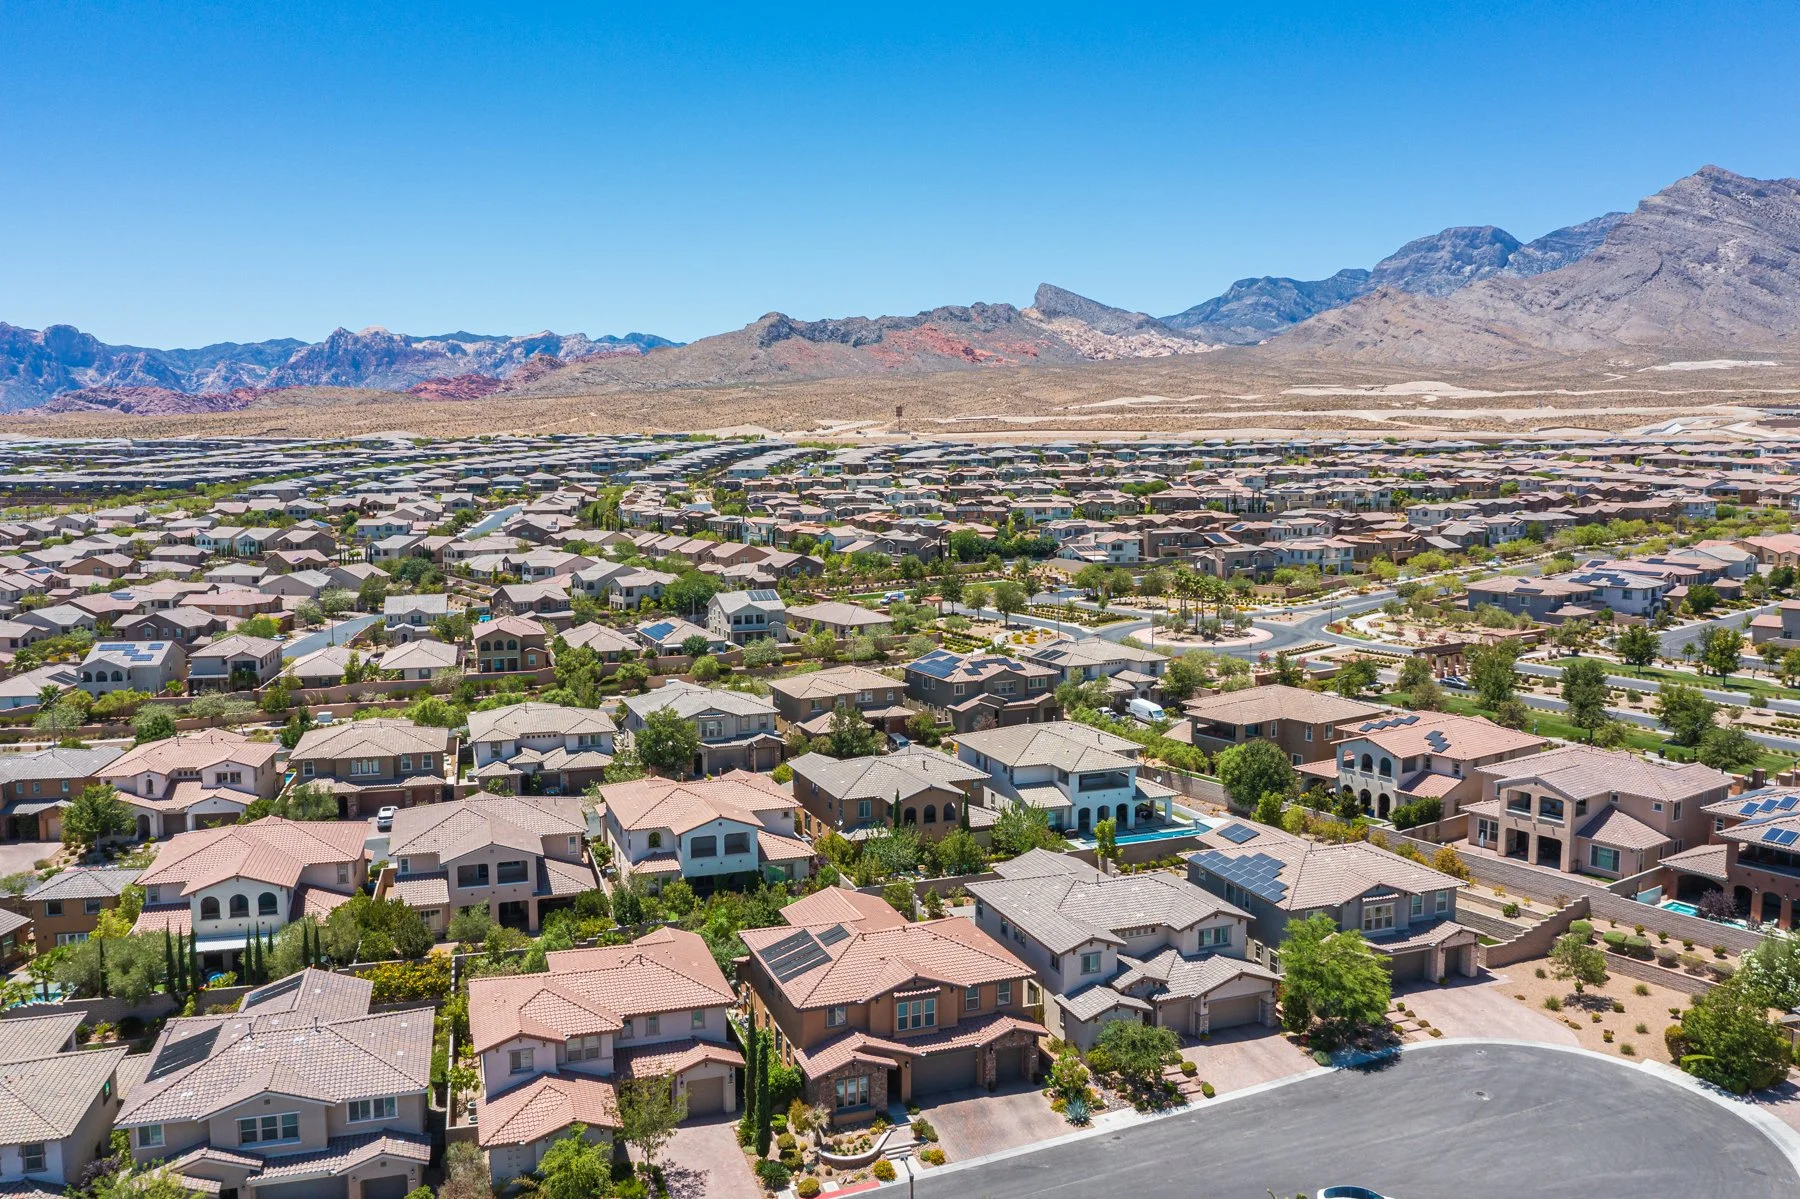
The Summerlin Market Report
The numbers below are an average. Your street is not.
One conversation, no obligation, and a read on what this data means for your specific ZIP code and price point.
Most Summerlin Home Sales Never Appear In The MLS
Over the last twelve months, 2,811 homes sold across the four ZIP codes that make up Summerlin.
The Multiple Listing Service recorded 1,950 of them.
The difference is builder activity. Builders closed 1,022 homes in Summerlin over that period. Only 161 of those closings, about 16 percent, were ever listed in the MLS. The rest were written directly at builder sales offices. Some of those buyers found the community on their own.
Many were brought there by agents who already knew which builders could meet that buyer's requirements, which had available lots matching their criteria, and which had standing inventory ready to go. Either way, the transaction never touches the MLS, and it appears in no online search, no portal, and no market report built from MLS data alone.
In Summerlin West, builders sold more homes than the entire resale market.
Summerlin Home Sales By ZIP Code
| ZIP Code | Area | Resale Sales | Builder Sales | Total Market | Builder Share |
|---|---|---|---|---|---|
| 89138 | Summerlin West | 483 | 794 | 1,277 | 62% |
| 89135 | Summerlin South and Centre | 530 | 217 | 747 | 29% |
| 89134 | Summerlin North | 551 | 0 | 551 | 0% |
| 89144 | Summerlin North | 225 | 11 | 236 | 5% |
| Total | 1,789 | 1,022 | 2,811 | 36% |
Resale figures are from the Greater Las Vegas Association of Realtors MLS.
Builder figures are recorded closings from Clark County records, compiled by Home Builders Research, and include sales that never appeared in the MLS.
89134 is fully built out. Every sale there is a resale. 89138 is the opposite. Nearly two out of every three homes sold were built and sold by a builder.
Buying A Home In Summerlin: What This Data Means
A buyer searching online is seeing the MLS. In Summerlin West, that means only seeing 38 percent of the homes that actually sold. In the under one million dollar range there, it means seeing less than a third.
The homes that are missing are not obscure. They are active builder communities with standing inventory, quick move in homes, and incentives that change month to month. They simply do not get listed, because a builder with steady traffic through the sales office has no reason to pay for MLS exposure.
You cannot find this inventory from a portal, and you cannot evaluate it from out of state. Builder incentives are negotiated, not published. Standing inventory turns over weekly. Which lots in which phase are actually available is not information that exists on a website.
You can be represented at a builder sales office, and you should be. Builders work with agents routinely, and a large share of these unlisted transactions are written with an agent involved.
The real value is knowing where not to go. There are dozens of active builder communities across Summerlin, and most of them will not have what any given buyer needs. Some do not build the square footage or floor plan you are after. Some have no remaining lots in the orientation or view corridor you want. Some have nothing standing that would close in your timeframe. An agent who works these communities every week knows all of that before you get in the car.
That is what saves a buyer the most time. Not a longer list of options, but a shorter one. Instead of spending weekends driving between sales offices and discovering that most of them cannot meet your requirements, you visit the three or four that actually can.
For an out of state buyer, that difference is measured in flights. Most buyers relocating to Summerlin are not local. Every trip out to look means airfare, a hotel, a rental car, and time away from work. Spending two of those trips ruling out communities that were never going to work is an expensive way to gather information that the right agent already has.
The alternative is straightforward. Before you book anything, someone who is in these neighborhoods weekly narrows the field to what genuinely fits, sends you current photos and pricing on the specific homes worth seeing, and builds an itinerary around them. Buyers who do this frequently make one trip instead of three.
Serena Heuser works Summerlin buyers directly and tracks builder inventory across Summerlin West and Summerlin South as it changes. Which builders can accommodate your requirements, which have lots that fit your criteria, and which have finished homes available right now is information that changes constantly and exists nowhere online.
If you are starting a search, our buying a home page walks through how the process works in this market.
Selling A Home In Summerlin: What This Data Means
You have far more competition than the MLS shows you.
If you are selling a home under one million dollars in Summerlin West, the MLS shows 287 resale sales in your segment over the last year. The real number of competing sales is 913, because builders closed 626 more.
Those builder homes are new, they come with warranties, and Las Vegas builders have been offering aggressive incentives including rate buydowns, design center credits and closing cost assistance. Local reporting in 2026 put the share of builders offering incentives at roughly two thirds, the highest level in years.
Pricing your home accurately is not optional in that environment. An ambitious list price does not get tested against three neighboring resale listings. It gets tested against an entire builder community that can adjust its own pricing and financing terms in ways an individual seller cannot.
Our selling a home page covers how we approach pricing and positioning against this kind of competition.

Two thirds of the Summerlin market is not on a website.
Tom and Serena can tell you what is actually available at your price point, or what you are really competing against.
Summerlin Home Prices By ZIP Code And Price Range
These tables show resale sales and builder sales side by side, so you can see the full competitive picture at your price point rather than the MLS slice of it.
89138 | Summerlin West
| Price Range | Resale Sales | Builder Sales | Total Market | Builder Share |
|---|---|---|---|---|
| Under $1M | 287 | 626 | 913 | 69% |
| $1M to $1.5M | 128 | 73 | 201 | 36% |
| $1.5M and above | 68 | 95 | 163 | 58% |
| Total | 483 | 794 | 1,277 | 62% |
Summerlin West is where the master plan is still being built. Villages including La Madre Peaks, Grand Park, Redpoint and Kestrel account for much of the current construction activity, and that is reflected directly in the sales numbers.
Builders own the entry level here. Nearly seven in ten homes sold under one million dollars in Summerlin West were builder sales. A resale seller in that range is competing primarily against new construction, not against neighbors.
Builders also account for well over half of everything above $1.5M, concentrated in the $1.5M to $3M range.
| Price Range | Median | Change | Average | Change |
|---|---|---|---|---|
| Under $1M | $725,000 | -2.0% | $725,097 | -1.1% |
| $1M to $1.5M | $1,225,000 | +1.6% | $1,218,776 | +0.6% |
| $1.5M and above | $1,875,000 | +2.7% | $2,011,755 | +4.2% |
Selling here under $1M: pricing accurately is critical. Resale values in this segment declined about two percent over the year, and you are competing against 626 builder closings in the same price range.
Buying here: the largest selection of homes for sale in Summerlin at any price, though most of it is not in the MLS. Luxury homes in 89138 concentrate between $1.5M and $3M, much of it newer construction. Above $3M, this market effectively stops.
89135 | Summerlin South and Summerlin Centre
| Price Range | Resale Sales | Builder Sales | Total Market | Builder Share |
|---|---|---|---|---|
| Under $1M | 299 | 4 | 303 | 1% |
| $1M to $1.5M | 68 | 0 | 68 | 0% |
| $1.5M and above | 163 | 213 | 376 | 57% |
| Total | 530 | 217 | 747 | 29% |
This ZIP code contains several of Summerlin's established luxury villages, including The Ridges, Red Rock Country Club, The Peaks and The Cliffs.
This is the reverse of Summerlin West. Builders are essentially absent below $1.5M and then take 57 percent of the luxury tier.
The MLS shows 163 resale sales above $1.5M in this ZIP code. The real number is 376. A buyer shopping Summerlin luxury from a portal is seeing well under half of what actually sold.
| Price Range | Median | Change | Average | Change |
|---|---|---|---|---|
| Under $1M | $640,000 | -2.0% | $666,219 | -0.7% |
| $1M to $1.5M | $1,230,000 | -1.9% | $1,246,749 | +0.6% |
| $1.5M and above | $2,400,000 | -3.4% | $3,346,848 | +0.5% |
The average sale price above $1.5M sits nearly a million dollars above the median. That spread reflects a genuinely deep upper tier rather than a few outliers.
Selling here above $1.5M: you are in the deepest luxury market in Summerlin, but more than half your competition is a builder. This ZIP code also carries the highest months supply in the master plan at 5.6, and homes are receiving 97.2 percent of list price, the lowest of the four.
Buying here above $3M: this is realistically your primary option for luxury homes in Summerlin, and much of the inventory is not publicly listed. 89135 is the only Summerlin ZIP code with meaningful sales activity above five million dollars.
89134 | Summerlin North
| Price Range | Resale Sales | Builder Sales | Total Market |
|---|---|---|---|
| Under $1M | 479 | 0 | 479 |
| $1M to $1.5M | 43 | 0 | 43 |
| $1.5M and above | 29 | 0 | 29 |
| Total | 551 | 0 | 551 |
Fully built out. No builder activity recorded. What you see in the MLS is the entire market, which makes this the most transparent of the four ZIP codes.
Villages in this ZIP code include The Hills, The Hills South and The Trails, alongside a large age restricted community.
| Price Range | Median | Change | Average | Change |
|---|---|---|---|---|
| Under $1M | $516,312 | -2.5% | $554,251 | -1.7% |
| $1M to $1.5M | $1,200,000 | +3.4% | $1,216,877 | -1.5% |
| $1.5M and above * | $2,400,000 | -10.3% | $2,665,779 | -17.4% |
* A note on the $1.5M and above figures. This segment recorded 29 sales over the twelve months, roughly two per month. At that volume, the median and average are set by a small number of individual transactions, and a single unusually large or small sale moves them significantly.
The declines shown here are more likely a reflection of which specific homes happened to sell than a real drop in value at this price point. Read them as a description of the sales that occurred, not as a measure of what a home in this range is worth today.
The $1M to $1.5M segment grew 79.2 percent, the fastest growing segment anywhere in Summerlin.
The age restricted community gives this ZIP code a different buyer profile from the rest of the master plan. It also reaches higher at the top than its $550,000 overall median would suggest, with sales recorded above $5M.
Selling here under $1M: values softened about 2.5 percent, but this segment has the lowest months supply in Summerlin at 4.2 and no builder competition at all.
Buying here: the largest under $1M resale market in Summerlin at 479 sales.
89144 | Summerlin North
| Price Range | Resale Sales | Builder Sales | Total Market |
|---|---|---|---|
| Under $1M | 173 | 0 | 173 |
| $1M to $1.5M | 27 | 11 | 38 |
| $1.5M and above | 25 | 0 | 25 |
| Total | 225 | 11 | 236 |
The smallest of the four ZIP codes and nearly built out, with a single active builder community. Villages here include The Canyons and The Arbors.
| Price Range | Median | Change | Average | Change |
|---|---|---|---|---|
| Under $1M | $565,000 | +3.5% | $601,226 | +3.2% |
| $1M to $1.5M | $1,165,000 | -5.9% | $1,197,037 | -2.4% |
| $1.5M and above | $2,600,000 | +12.6% | $2,732,490 | +15.0% |
89144 runs opposite to the rest of Summerlin at both ends. It is the only ZIP code where homes under $1M gained value, rising 3.5 percent while the other three declined about two percent. It is also the only ZIP code where sales above $1.5M declined, falling 28.6 percent.
It is the fastest moving market in Summerlin, with a median 24 days on market.
Selling here under $1M: this is the one segment in Summerlin that appreciated over the last year, with only 81 competing listings across the entire ZIP code.
Buying here between $3M and $5M: this ZIP code recorded 9 sales in that range, second only to 89135.
Summerlin Luxury Home Sales By Price Range
Summerlin is the primary luxury home market in Las Vegas, but luxury activity is not spread evenly across it. The four ZIP codes reach very different price ceilings, and a buyer shopping above two million dollars has meaningfully fewer options than the overall sales numbers suggest.
| Price | 89135 | 89138 | 89134 | 89144 |
|---|---|---|---|---|
| $1.5M to $2M | 46 | 47 | 7 | 6 |
| $2M to $3M | 86 | 35 | 15 | 10 |
| $3M to $5M | 38 | 1 | 5 | 9 |
| $5M and above | 21 | 0 | 2 | 0 |
This table reflects MLS activity only. It includes resale homes plus the small share of builder sales that were listed in the MLS. It does not include the builder sales that were never listed, which add approximately 95 homes above $1.5M in 89138 and approximately 213 in 89135, both concentrated between $1.5M and $3M.
Segments with fewer than 30 sales can swing significantly on a small number of transactions. Read year over year changes in these segments as directional rather than precise.
Summerlin New Construction Home Sales
| ZIP Code | Total Builder Closings | Appeared In The MLS | MLS Share |
|---|---|---|---|
| 89138 | 794 | 134 | 17% |
| 89135 | 217 | 27 | 12% |
| 89134 | 0 | 0 | n/a |
| 89144 | 11 | 0 | 0% |
| Total | 1,022 | 161 | 16% |
For every builder closing that appeared in the MLS in Summerlin last year, five more closed without it.
| Price Range | 89138 | 89135 | 89144 |
|---|---|---|---|
| Under $1M | 626 | 4 | 0 |
| $1M to $1.5M | 73 | 0 | 11 |
| $1.5M to $2M | 40 | 74 | 0 |
| $2M to $3M | 55 | 139 | 0 |
Builder price ranges are estimated. Each builder community is assigned to a price range based on its average closing price over the last twelve months.
A community with an average close price near a range boundary will have sold homes on both sides of it, so these figures are directionally accurate rather than exact. Resale figures elsewhere in this report are exact.
More detail on active builder communities across the valley is available on our new construction homes page.
Two very different builder strategies in adjacent ZIP codes. In Summerlin West, builders are concentrated in the entry level and mid market. In Summerlin South, builders are essentially absent below $1.5M and are building almost exclusively above $2M.
One more thing worth understanding about these numbers.
Across all of Southern Nevada, builders closed 8,833 homes over this same twelve month period, an average of 736 per month. Summerlin accounted for 1,022 of them, roughly 12 percent of all builder activity in the valley.
Valley wide builder volume has been declining. Builders closed 9,990 homes in 2025, down 20 percent from 2024 and the lowest annual total since 2016, and the pace through the first half of 2026 ran below that.
Yet MLS new construction listings in 89138 rose 47 percent over the last year. That is a shift in channel, not a shift in volume. When the market slows, builders need traffic, and listing in the MLS becomes a way to find buyers. When the market is fast, they do not need it.
The practical consequence is that builder competition is becoming more visible to resale sellers at the same time that it is becoming more aggressive on price.

Summerlin Compared To The Las Vegas Valley
| Market | Closed Sales | Change | Dollar Volume | Change |
|---|---|---|---|---|
| Entire Las Vegas MLS | 22,967 | -1.3% | $14.17B | +0.7% |
| 89138 | 619 | +11.9% | $621.8M | +16.5% |
| 89135 | 560 | +9.4% | $922.4M | +17.3% |
| 89134 | 551 | +5.6% | $395.1M | +5.5% |
| 89144 | 225 | +5.1% | $204.6M | +2.1% |
Closed sales here include new construction listed in the MLS, so they run higher than the resale only figures shown earlier by ZIP code.
Transactions across the valley declined. Every Summerlin ZIP code grew.
But two figures cut against a simple outperformance story.
Inventory built faster in Summerlin than in the valley: homes for sale rose 13.2 percent across the MLS and between 21.8 and 35.1 percent across the four ZIP codes. And sellers accepted larger reductions from list price. The valley median settled at 99.1 percent of list. All four Summerlin ZIP codes landed between 97.2 and 97.9 percent.
Summerlin is not tighter than the valley. It is busier, with more selection and more negotiation.
| Measure | 89138 | 89135 | 89134 | 89144 |
|---|---|---|---|---|
| Median Days on Market | 34 | 29 | 30 | 24 |
| Change | +30.8% | +31.8% | +30.4% | +50.0% |
| Months Supply | 5.3 | 5.6 | 4.2 | 4.4 |
| Percent of List Received | 97.8% | 97.2% | 97.6% | 97.9% |
| Homes for Sale | 254 | 251 | 190 | 81 |
Days on market rose between 30 and 50 percent in every ZIP code. Homes are taking meaningfully longer to sell than they did a year ago, everywhere in Summerlin.
Out Of State Buyers Relocating To Summerlin
A significant share of luxury home activity in Summerlin is coming from buyers relocating from outside Nevada.
Buyers relocating from higher priced markets arrive with substantial equity and are measuring Summerlin against what they left rather than against local price history. A home at $1.5M in Summerlin reads very differently to a buyer selling in Los Angeles than it does to a buyer already living here.
Many of these purchases are second homes rather than primary residences.
Nevada does not levy a state income tax, and that is a frequently cited factor among buyers relocating from states that do.
Redfin migration data, first quarter 2026, shows the top metro areas whose residents were searching for Las Vegas homes:
| Rank | Moving to Las Vegas from | Net Inflow |
|---|---|---|
| 1 | Los Angeles, CA | 3,778 |
| 2 | San Francisco, CA | 1,129 |
| 3 | Seattle, WA | 860 |
| 4 | San Diego, CA | 327 |
| 5 | Chicago, IL | 313 |
| 6 | Honolulu, HI | 222 |
| 7 | Washington, DC | 188 |
| 8 | New York, NY | 186 |
| 9 | Boston, MA | 91 |
| 10 | Sacramento, CA | 84 |
Redfin ranked Las Vegas among the most popular destinations nationally for relocating homebuyers in the first quarter of 2026, and identified Los Angeles buyers as increasingly searching in Las Vegas. At the state level, Nevada ranked among the top destination states nationally, while California posted the largest net outflow of any state.
This data measures search behavior rather than completed moves. Redfin counts a user as a potential migrant if they view at least 20 for sale homes in a destination metro during a one month period.
Data covers January through March 2026, the most recent quarter published.
Buyers considering a move for tax reasons should consult a qualified tax professional about their specific situation.
The practical consequence is that the incremental buyer in Summerlin is entering above $1M. That is why the top of the market is accelerating while the entry level softens.
Summerlin Market Summary
The MLS is not the Summerlin market. It is a little under two thirds of it. Builder activity accounts for the rest, and five out of every six builder closings were written without ever being listed. Any analysis drawn from MLS data alone, including most of what you will find online, is working from an incomplete picture.
Summerlin is four different markets. 89138 is builder dominated at 62 percent of all sales, with luxury homes concentrated between $1.5M and $3M. 89135 is the center of the Summerlin luxury market and the only ZIP code with real depth above five million dollars. 89134 is fully built out with no builder activity at all. 89144 is small, fast, and nearly built out.
Resale values under $1M declined roughly two percent in three of the four ZIP codes. Only 89144 gained, rising 3.5 percent.
The $1M to $1.5M segment grew by double digits in all four ZIP codes, from 23.7 percent in 89138 to 79.2 percent in 89134. It is the most consistent pattern in the data and the segment least discussed.
Inventory and days on market rose everywhere. Homes are taking 30 to 50 percent longer to sell than a year ago, and sellers in all four ZIP codes are receiving less of their list price than the valley average.
If there is one takeaway: the headline median for Summerlin tells you very little. What matters is which ZIP code, which price point, and whether you are counting the two thirds of the market that never reaches the MLS.
How To Read This Report
Resale figures cover single family detached homes only. Condominiums, townhomes, and other attached product are excluded from all resale figures.
All figures cover the trailing twelve months compared against the twelve months before. A trailing twelve month figure absorbs seasonal swings and gives a more stable read than any single month.
Two data sources are combined in this report. Resale figures come from the Greater Las Vegas Association of Realtors MLS and cover August 2025 through July 2026. Builder figures are compiled from the Home Builders Research Las Vegas New Home Closings Report, which draws on recorded Clark County closings, and cover July 2025 through June 2026. The two periods are offset by one month. The comparison is directionally sound but not an exact month for month match.
Resale figures exclude new construction to prevent double counting. Where a builder sale was listed in the MLS, it is counted once, in the builder column.
Builder price ranges are estimated by assigning each builder community to a range based on its average closing price. Resale price ranges are exact.
Four ZIP codes are included: 89138, 89135, 89134 and 89144. These contain the large majority of Summerlin. ZIP codes 89117 and 89128 are excluded because Summerlin represents a minority of each. Our Clark County ZIP code map shows how these boundaries fall across the valley.
Resale data: Greater Las Vegas Association of Realtors MLS, August 2025 through July 2026, accessed August 2026. Builder data: Home Builders Research, Las Vegas New Home Closings Report, July 2025 through June 2026. Historical annual comparisons and builder incentive share from published local reporting.
Migration data: Redfin, first quarter 2026. This report is updated quarterly.
Questions About Your Specific Situation
Every number on this page is an average of many homes. Your home is not an average, and neither is your search.
If you are buying in Summerlin, a substantial share of the inventory at your price point is not something you can find online. If you are selling, your competition is larger than the MLS shows you.
We are glad to walk through what this data means for your specific property or your specific search.